The GCM Kinetic Flux Spectrum Indicator is an institutional-grade hybrid momentum and volume engine. Unlike standard oscillators that rely on closing prices, the GCM KFS synthesizes dual-source RSI volatility with Volume Flow Intensity (VFI) to reveal the hidden kinetic energy of market movements.
By projecting a 27-layer “Spectrum Ribbon” and a multi-dimensional Divergence Engine, the GCM KFS identifies not just where the price is heading, but the quality and “fuel” behind the trend.
CORE ARCHITECTURE
1) The Kinetic Mean (Dual-Source RSI)
Standard RSI often ignores the battle occurring at the wicks. The GCM KFS calculates independent RSI streams for Highs and Lows, then anchors them to a Zero-Centered baseline (-50 to +50). The resulting Kinetic Mean filters out retail noise, providing a volatility-adjusted perspective on momentum.
2) Volume Flux Integration (VFI)
Volume precedes price. The GCM KFS integrates a highly responsive, EMA-smoothed Volume Flow Indicator (VFI). By syncing VFI length with the RSI cycle, the indicator cross-verifies price strength with capital flow.
• Momentum + Positive Flux: Confirms high-conviction trends.
• Momentum + Negative Flux: Reveals “Empty” breakouts or institutional distribution.
3) 27-Layer Spectrum Ribbon
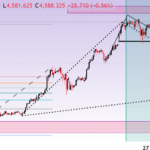
The gradient fill isn’t just aesthetic—it represents Volatility Density.
• Expansion: When ribbons fan out, it signals a high-velocity trend.
• Compression (The Squeeze): When ribbons pinch toward the Kinetic Mean, it signals a volatility contraction, typically the precursor to an explosive breakout.
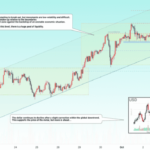
4) Four-Way Divergence Engine
The KFS automatically detects and projects four types of divergence on both the indicator pane and the main price chart: Flux Spectrum Indicator
• Regular Bullish/Bearish: Identifying high-probability trend reversals.
• Hidden Bullish/Bearish: Identifying trend continuation (Smart Money re-entry points).
KEY POWER FEATURES
• Zero-Centered Logic: Levels are shifted for better visual balance. (OB: +20, Extreme OB: +30 | OS: -20, Extreme OS: -30).
• Dynamic Zones: Flux Spectrum Indicator Subtle background fills highlight “Extreme” areas where price is statistically likely to mean-revert.
• Main Chart Projection: Use the force_overlay feature to keep your eyes on price action while the indicator confirms entries.
• Institutional Dotted VFI: The orange dotted line acts as the “Anchor”—if price rises but the VFI Anchor stays below zero, the move lacks professional backing.
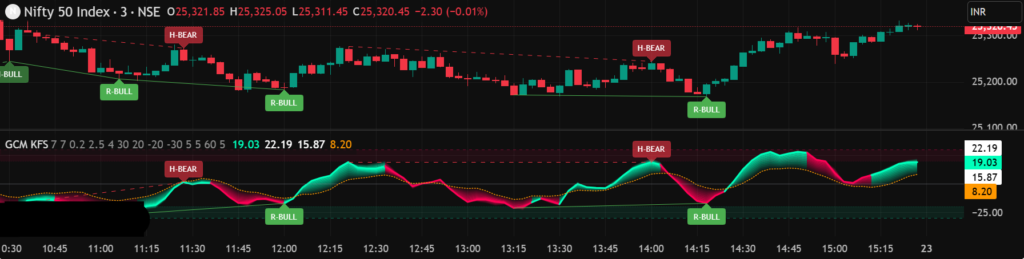
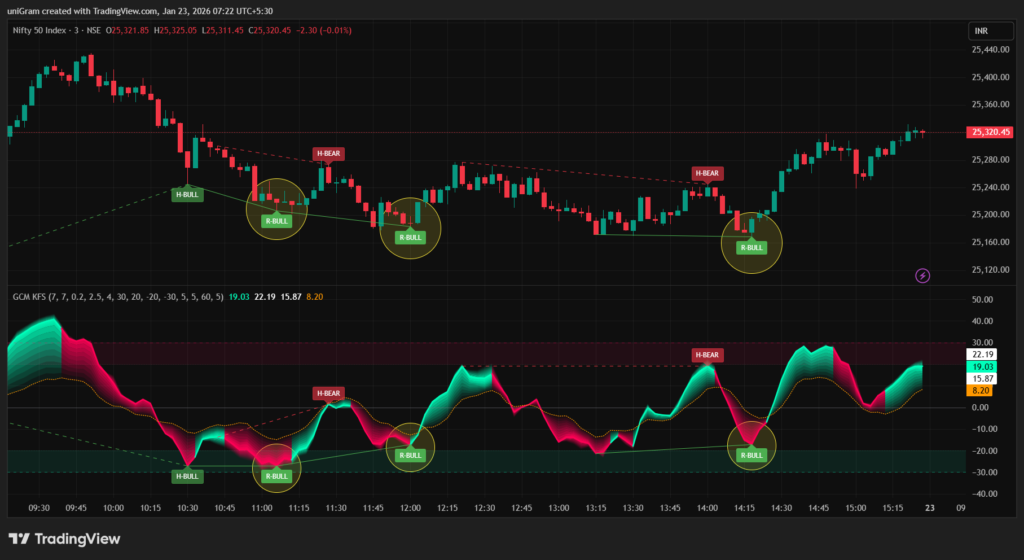
HOW TO TRADE WITH GCM-KFS
• The Reversal Sniper: Flux Spectrum Indicator Look for an R-BULL or R-BEAR label appearing inside the Extreme Zone (±30). This indicates momentum exhaustion backed by a volume shift.
• Trend Riding: During an uptrend, look for H-BULL (Hidden Bullish) labels. This signals that institutions are “buying the dip” while momentum resets.
• Volatility Breakouts: When the Flux Spectrum Indicator Ribbon enters a tight “squeeze” near the Zero Line, prepare for a major move. Follow the direction of the first ribbon expansion.
RECOMMENDED SETTINGS
• Scalping (1m – 5m): Length 7 – 9
• Day Trading (15m – 1H): Length 10 – 14
• Swing Trading (4H – Daily): Length 20+
𝐂𝐨𝐧𝐭𝐚𝐜𝐭 𝐦𝐞, 𝐭𝐨 𝐠𝐞𝐭 𝐈𝐧𝐝𝐢𝐜𝐚𝐭𝐨𝐫’𝐬 𝐋𝐢𝐜𝐞𝐧𝐬𝐞:
Discord: fadelqasim99
Telegram: https://t.me/fadelqasim
Email: support@forextradingindicator.com