Skip to content
-
To get our Indicator's License, Contact Us👇
Qasim Pro Indicator

Best Binary & Forex Trading Indicators Archives | Download

  • Home
  • Best Brokers
  • Binary Indicators
  • Forex Indicators
  • Technical Analysis
Contact Us

Technical Analysis

Home | Technical Analysis | Page 2

Bitcoin’s Symmetrical Triangle Breakdown – How Low Can It Go
Posted inTechnical Analysis

Bitcoins Symmetrical Triangle Breakdown – How Low Can It Go?

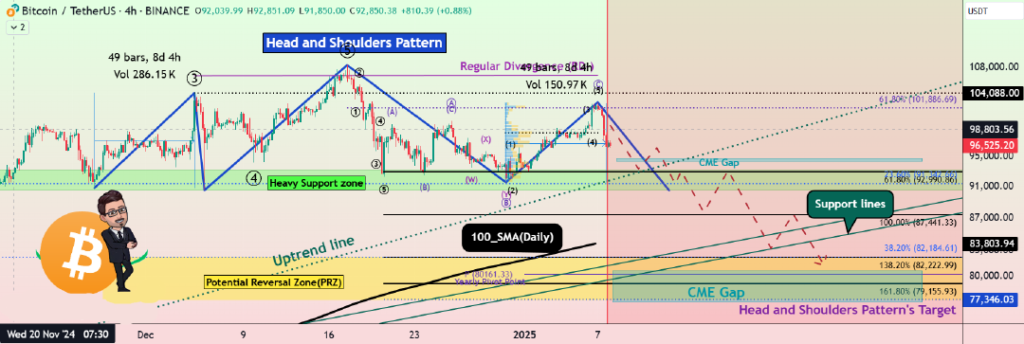
Bitcoin(BTCUSD) started to fall, as I expected in the previous post; the question here is whether the fall continues or not.Today, I want to analyze Bitcoin for you in the 15-minute time frame.Bitcoin was able to…
Posted by Fadel Qasim February 26, 2025No Comments
GOLD correction and the Road to Trend CONTINUATION
Posted inTechnical Analysis

GOLD correction and the Road to Trend CONTINUATION

GOLD correction and the Road to continues to climb, breaking above the 2850 level. At this point, the market appears unstoppable, pushing higher and higher. However, at times like this, the…
Posted by Fadel Qasim February 7, 2025No Comments
Bitcoin-is-Ready-to-Fall-Below-90000Reasons
Posted inTechnical Analysis

Bitcoin price is Ready to Fall Below $90,000!!! Reasons!!!

As I expected in the last few posts, Bitcoin Price (BTCUSDT) seems to have started a major correction. Please be with me. First, let's take a look at the weekly Bitcoin price action…
Posted by Fadel Qasim January 8, 2025No Comments
GOLD Weekly Market Technical Analysis
Posted inTechnical Analysis

GOLD Weekly Market Technical Analysis

The recent movement in the XAUUSD (GOLD) market indicates a period of consolidation after the initial upward momentum and the following pullback suggests that the market may not yet be ready to…
Posted by Fadel Qasim December 17, 2024No Comments
Bitcoin really cannot continue in this parabolic uptrend. Why? Because if yes, it would hit around 600,000 USD by December 2025. Of course that's impossible, so the only option is to slow down. Bitcon still hasn't made any bigger correction in past weeks and is currently facing a very significant psychological resistance of 100,000 USD. I am really not buying because the Moon Boys are back and first we need to see a shakeout and a flash crash. 85k is a very reasonable support because it's the end of the massive FVG (fair value gap) on the daily candles. Also, it's the start of the first price action on the volume profile. This is where you want to buy. What we cannot miss is the symmetrical triangle on the 4H chart. This to me looks like a bull trap on retail traders because everyone would buy the breakout. So there is still a possibility of making a last push to sweep liquidity (stop losses). Write a comment with your altcoin, and I will make an analysis for you in response. Also, please hit boost and follow for more ideas. Trading is not hard if you have a good coach! This is not a trade setup, as there is no stop-loss or profit target. I share my trades privately. Thank you, and I wish you successful trades!
Posted inTechnical Analysis

Bitcoin – Ultimate bull trap, soon a big crash! (must see)

Bitcoin really cannot continue in this parabolic uptrend. Why? Because if yes, it would hit around 600,000 USD by December 2025. Of course that's impossible, so the only option is…
Posted by Fadel Qasim December 5, 2024No Comments
XRP Ripple Roadmap!!!(Short-term)
Posted inTechnical Analysis

XRP Ripple Roadmap!!! (Short-term)

XRP Ripple I hope you had a good weekend. According to the news about XRP, I decided to share an analysis of it with you today. Ripple is planning to launch RLUSD Stablecoin on…
Posted by Fadel Qasim December 2, 2024No Comments
Bitcoin Correction Started!? Can Reach 100K?
Posted inTechnical Analysis

Bitcoin Correction Started!? Can Reach 100K?

Bitcoin (BTCUSDT) started pumping again today with the help of the following two News: 1-Chinese Court Declares Bitcoin and Crypto Ownership Legal.2-Trump Plans White House Crypto Advisor Role. These days, Bitcoin is more influenced by the…
Posted by Fadel Qasim November 25, 2024No Comments
Looking-for-NAS100-to-Short-back-to-Previous-Structure-High.
Posted inTechnical Analysis

Looking for NAS100 to Short back to Previous Structure High.

Looking for NAS100 to Short back to Previous Structure High. Possible descending triangle forming.look fore bearish sell to trend line/61.8/H4 lvl or H4Structure point 50% prz/daily lvl 20,595H1 lvl showing…
Posted by Fadel Qasim November 16, 20241
Euro can exit from pennant and rise to 1.0700 points!
Posted inTechnical Analysis

Euro can exit from pennant and rise to 1.0700 points!

Euro can exit from pennant and rise to 1.0700 points! Hello traders, I want share with you my opinion about Euro. Observing the chart, we can see how the price…
Posted by Fadel Qasim November 14, 2024No Comments
Bitcoin - If you buy, you can get REKT in 2025!
Posted inTechnical Analysis

Bitcoin – If you buy, you can get REKT in 2025!

Bitcoin - If you buy, you can get REKT in 2025! Bitcoin is forming a historical bearish divergence on the weekly chart. As we can see, the price is making…
Posted by Fadel Qasim November 9, 20241

Posts pagination

Previous page 1 2 3 Next page

Best Brokers for 2026

banner image

Copyright 2026 — Qasim Pro Indicator. All rights Reserved.
Scroll to Top